Are you using your Digital Radiography Histogram effectively?
A Histogram is a graphical display of the pixel intensity distribution for a digital image. A Histogram plots the number of pixels found at each pixel value. The left side of the graph typically represents the lower signal values (less exposure) and the right side represents the higher signal values (more exposure). The height of each peak represents the number of pixels having that specific value. A quick glance at a histogram can provide immediate information about a radiographic technique and the associated product. For example, if a product having multiple thicknesses is imaged, the following histograms each offer valuable information about the technique and image it will provide.
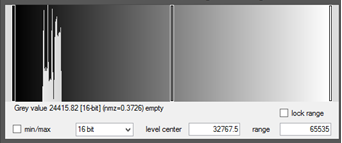
Histogram 1: The signal value peaks from the various thicknesses cover a very narrow range of pixel values, all of which are shifted to the left side of the histogram. This indicates an image with a low signal ,without frame averaging, will produce a low Signal to Noise Ratio (SNR) and low contrast.
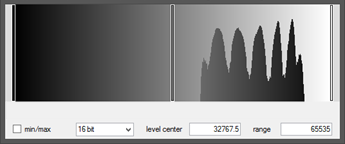
Histogram 2: The signal value peaks cover a relatively narrow range of pixel values, all of which are shifted to the right side of the histogram. This indicates an image with a high signal which will have an improved SNR however only a medium contrast.
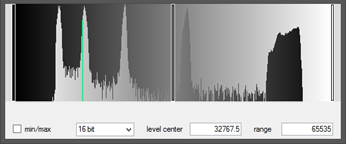
Histogram 3: The signal value peaks cover the majority of the width of the histogram range of pixel values. This indicates both a high signal level and high contrast image. The left signal values (thicker sections of the material) will have a lower SNR than the right signal values (thinner sections of material).