Key Variables For Contrast Sensitivity
There are a number of variables that contribute to improved contrast sensitivity in a sample:
1. FACTOR: SAMPLE THICKNESS– Sample thickness is a vital part in determining what the contrast sensitivity will be. When acquiring two data sets of the same material, and scanning them at the same resolutions, it is clear that the thinner sample shows better contrast sensitivity on a similar void then the thicker sample.
2. FACTOR: MATERIAL DENSITY- Density of material is a key factor in determining whether the contrast sensitivity will be great, average, or poor. Less dense materials show better contrast sensitivity than higher density materials. Highly dense materials require higher energies, resulting in a larger percentage of density change in the material in order to see a difference compared to low density material. For example, composites or plastics where we are able to see subtle changes in the density of the materials.
3. FACTOR: SCANNING ENERGY- The lower the energy utilized for scanning the sample while still pulling the proper grey scale values, the better the contrast will be [1]. One key factor in this is the ability to move the detector closer to the tube, because the numbers of photons that make it to the detector increase by a factor of four.
The inverse square law applies to the tube to detector distance [2]. For example if you have 20 inches versus a 40 inch tube to detector distance it will get 4 times the photon count to the detector. This gives the CT technician the chance to either decrease the scan time, or lower the energy. Lowering the energy will produce better contrast sensitivity. Figures 3 and 4 below are great examples of what can be detected when utilizing tube to detector distance reduction to increase contrast. Samples similar to this are often done with a 40 inch or longer tube to detector distance. However, the examples shown in figures 3 and 4 were done with less than a twenty inch tube to detector distance.
4. FACTOR: PIXEL PITCH- The Pixel Pitch has an effect on the contrast sensitivity. The larger the pixel size, the more photons it is able to collect. This results in better contrast resolution while giving up some pixel resolution.
5. OTHER FACTORS- Many other variables contribute to contrast sensitivity such as, BIT depth, fill factor, and the scintillator material and thickness.
Technicians should consider all of these variables when optimizing a scan for contrast. This is a skill that requires a fair amount of training and practice to optimize your results full potential.
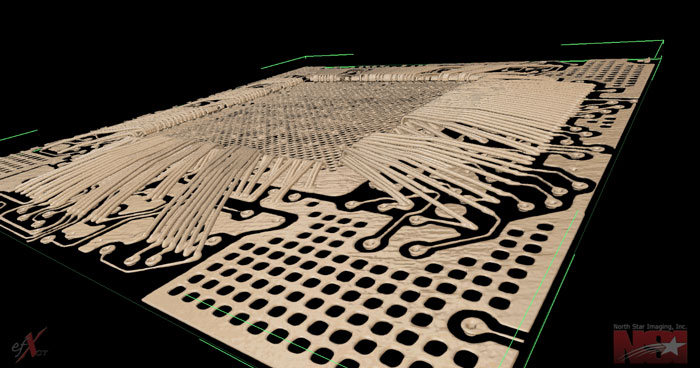
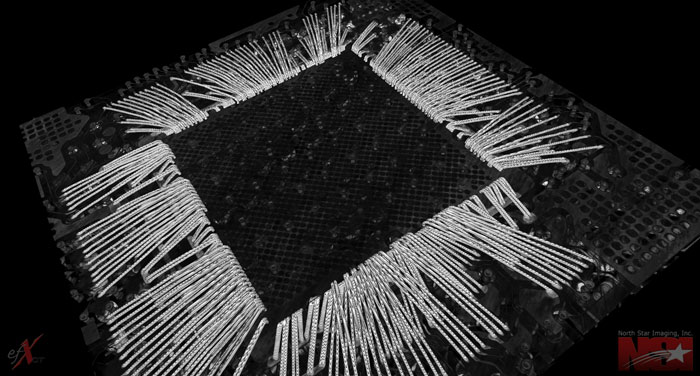
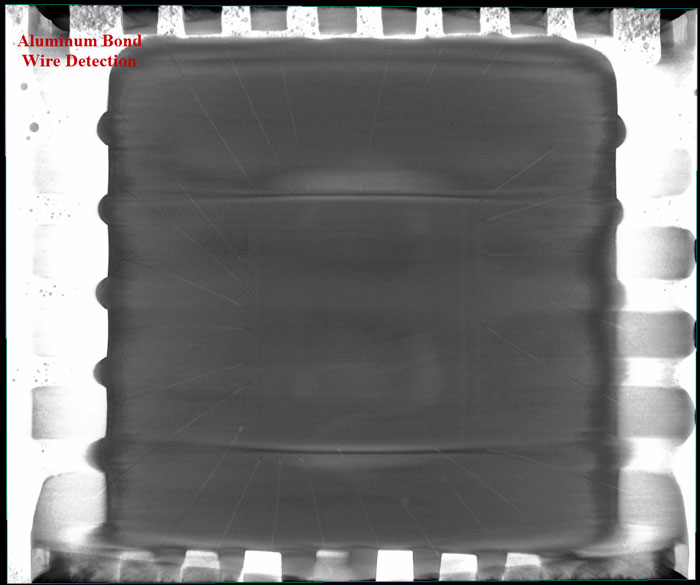
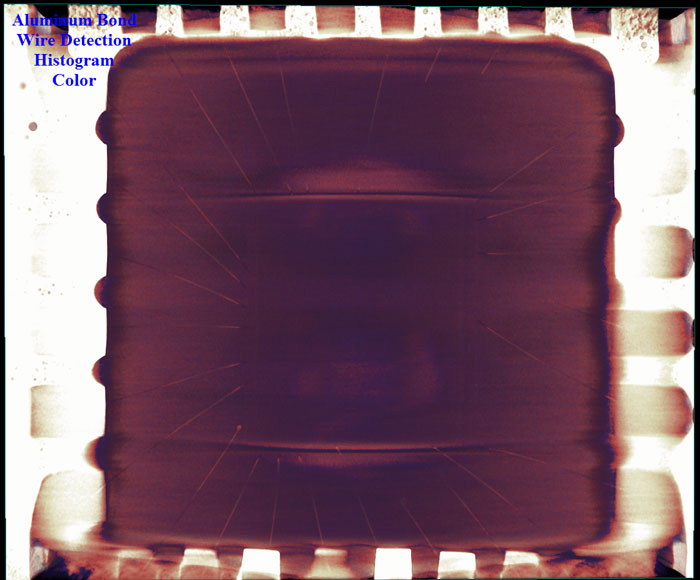
OPTIMIZING CONTRAST FOR ALUMINUM BOND AND TRACE WIRE INSPECTION
When optimizing for the detection of aluminum bond wires and trace wires, all of the factors discussed are vital for failure detection and inspection. Due to the low density of aluminum versus gold wires it is critical to understand and utilize all of the variables discussed above for superior results. Below in figures 3 and 4 you will find some images of an IC that has aluminum bond wires in it. The bond wires were detectable with longer scan times, shorter tube to detector distance, using a cesium scintillator, and the energies were kept as low as possible while achieving good grey scale values.
The data below clearly demonstrates that utilizing Computed Tomography data in imaging Aluminum Bond wires is possible, but the likelihood of success will depend heavily on the size of the package and density of the outer material. Figure 3 shows this by utilizing a black and white histogram, and figure 4 by utilizing a color histogram. Take a closer look at the images to see how utilizing color can help improve the visualization process when needed. In figures 1 and 2, the gold bond wires are much easier to evaluate due to the difference in the density of the material
[1] X-ray. (n.d.). In Wikipedia. Retrieved 2012, from h…
[2] Radiographic Inspection – Formula Based on Newton’s Inverse Square Law. (2012). In NDT Resource Center. Retrieved 2012, from h…